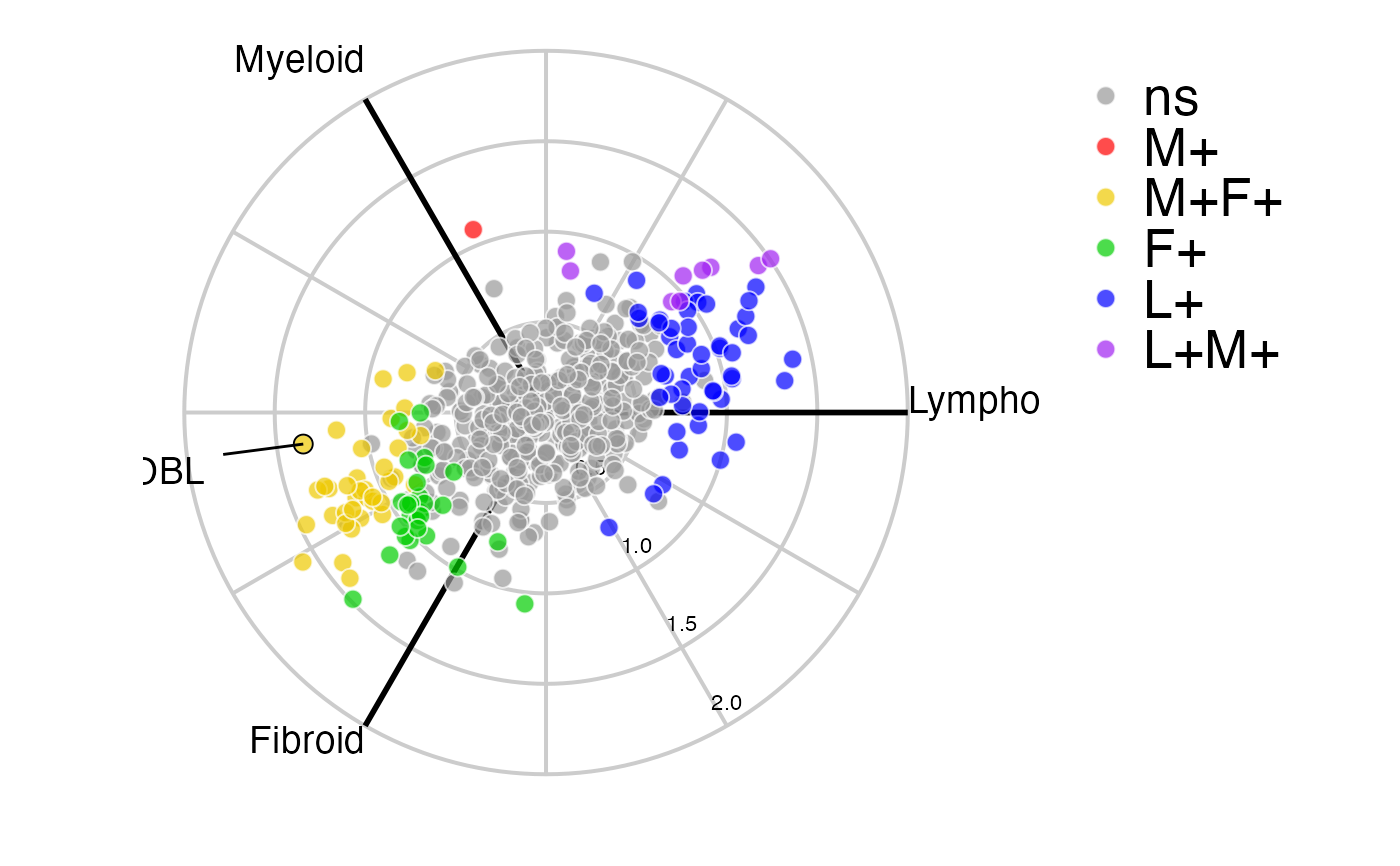
This function creates a 3-way polar plot using 'ggplot' for a three-class comparison.
radial_ggplot(
  polar,
  type = 1,
  colours = NULL,
  label_rows = NULL,
  arrow_length = 1,
  label_size = 5,
  colour_code_labels = FALSE,
  label_colour = "black",
  grid_colour = "grey80",
  grid_width = 0.7,
  axis_colour = "black",
  axis_width = 1,
  axis_title_size = 5,
  axis_label_size = 3,
  marker_alpha = 0.7,
  marker_size = 3,
  marker_outline_colour = "white",
  marker_outline_width = 0.5,
  legend_size = 20,
  ...
)
Arguments
| polar | A 'volc3d' object with the p-values between groups of interest
and polar coordinates created by |
|---|---|
| type | Numeric value whether to use scaled (z-score) or unscaled (fold change) as magnitude. Options are 1 = z-score (default) or 2 = unscaled/fold change. |
| colours | A vector of colours for the non-significant points and each of the six groups. |
| label_rows | A vector of row names or indices to label |
| arrow_length | The length of label arrows |
| label_size | Font size of labels/annotations (default = 5). |
| colour_code_labels | Logical whether label annotations should be colour
coded. If FALSE |
| label_colour | Colour of annotation labels if not colour coded |
| grid_colour | The colour of the grid (default="grey80") |
| grid_width | The width of the axis lines (default=0.6) |
| axis_colour | The colour of the grid axes and labels (default="black") |
| axis_width | The width of the axis lines (default=1) |
| axis_title_size | Font size for axis titles (default = 5) |
| axis_label_size | Font size for axis labels (default = 3) |
| marker_alpha | The alpha parameter for markers (default = 0.7) |
| marker_size | Size of the markers (default = 3) |
| marker_outline_colour | Colour for marker outline (default = white) |
| marker_outline_width | Width for marker outline (default = 0.5) |
| legend_size | Size for the legend text (default = 20). |
| ... | Optional parameters passed to |
Value
Returns a polar 'ggplot' object featuring variables on a tri-axis radial graph
References
Lewis, Myles J., et al. (2019). Molecular portraits of early rheumatoid arthritis identify clinical and treatment response phenotypes. Cell reports, 28:9
See also
Examples
data(example_data)
syn_polar <- polar_coords(outcome = syn_example_meta$Pathotype,
                          data = t(syn_example_rld))

radial_ggplot(polar = syn_polar, label_rows = c("COBL"))