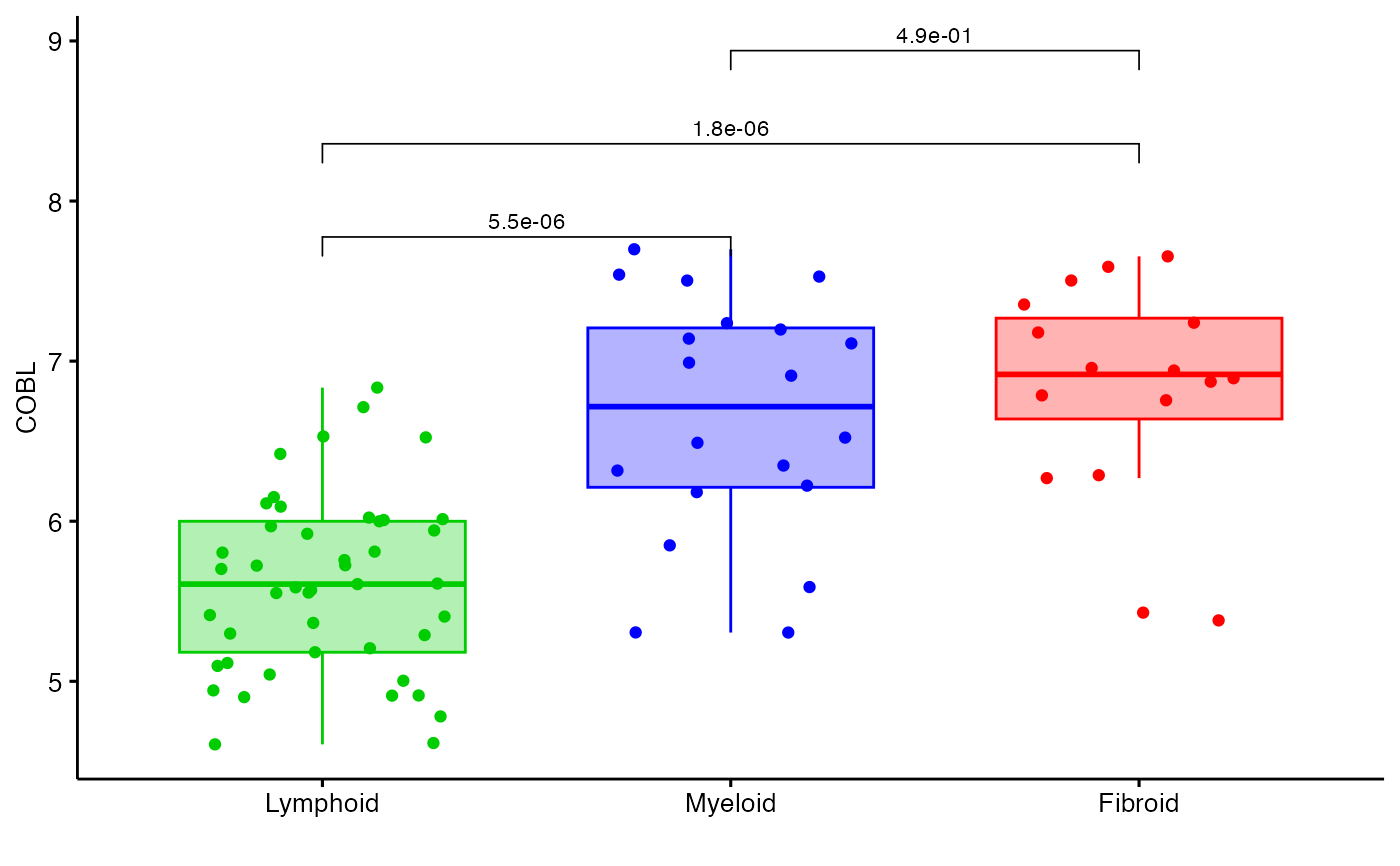
Plots the expression of a specific row in expression to compare the three groups in a boxplot using either ggplot or plotly.
boxplot_trio(
  polar,
  value,
  box_colours = c("green3", "blue", "red"),
  test = "polar_pvalue",
  levels_order = NULL,
  my_comparisons = NULL,
  text_size = 10,
  stat_colour = "black",
  stat_size = 3,
  step_increase = 0.05,
  plot_method = "ggplot",
  ...
)
Arguments
| polar | A 'volc3d' object including expression data from groups of
interest. Created by |
|---|---|
| value | The column name or number in |
| box_colours | The fill colours for each box assigned in order of levels_order. Default = c('green3', 'blue', 'red') ). |
| test | The statistical test used to compare expression. Allowed values include:
|
| levels_order | A character vector stating the contrast groups to be
plotted, in order. If |
| my_comparisons | A list of contrasts to pass to
|
| text_size | The font size of text (default = 10) |
| stat_colour | Colour to print statistics (default="black"). |
| stat_size | The font size of statistical parameter (default = 3). |
| step_increase | The distance between statistics on the y-axis (default = 0.05). |
| plot_method | Whether to use 'plotly' or 'ggplot'. Default is 'ggplot' |
| ... | Other parameters for |
Value
Returns a boxplot featuring the differential expression between groups in comparison with annotated pvalues.
References
Lewis, Myles J., et al. (2019). Molecular portraits of early rheumatoid arthritis identify clinical and treatment response phenotypes. Cell reports, 28:9
Examples
data(example_data)
syn_polar <- polar_coords(outcome = syn_example_meta$Pathotype,
                          data = t(syn_example_rld))

boxplot_trio(syn_polar, value = "COBL", plot_method="plotly")
boxplot_trio(syn_polar, value = "COBL")